Introduction to Backtesting
Backtesting is a crucial step in strategy development, allowing traders to test their methods against historical data and understand how they might perform under similar conditions in the future. For those in the forex and commodities markets, backtesting offers a safe way to experiment with and optimize strategies before deploying them in real trades.
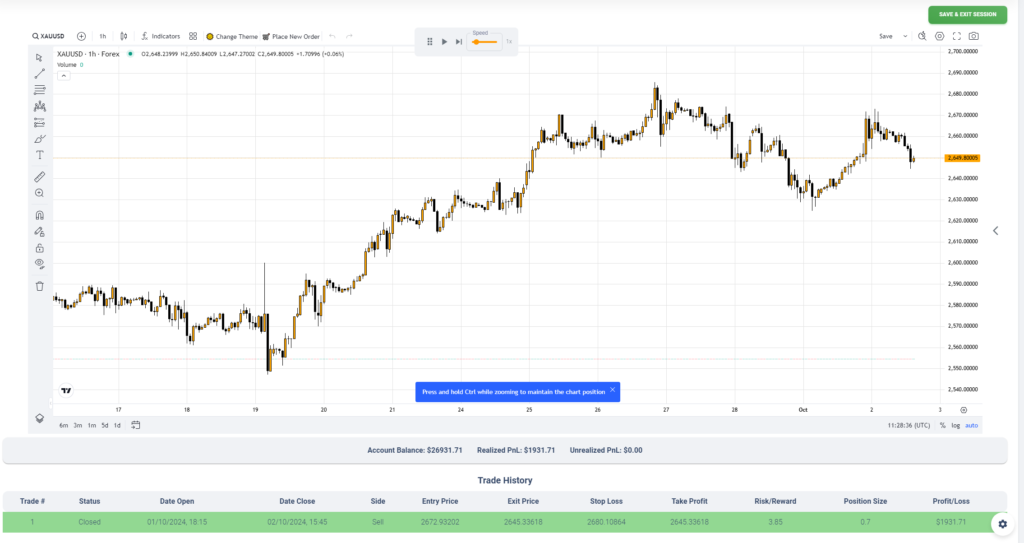
FX Bullsheet’s backtesting tool simplifies this process by enabling traders to explore and refine strategies with user-friendly playback controls, metrics, and visualizations. Powered by TradingView which is one of the best charting tools in the market.
Why Backtesting is Essential for Forex and Commodities
Effective backtesting is about building confidence in a strategy:
- Reducing Risk: Backtesting allows traders to identify weaknesses in a strategy without risking their capital.
- Enhancing Strategy Performance: By seeing how strategies perform in different market conditions, traders can adapt their approach, increasing the likelihood of profitability.
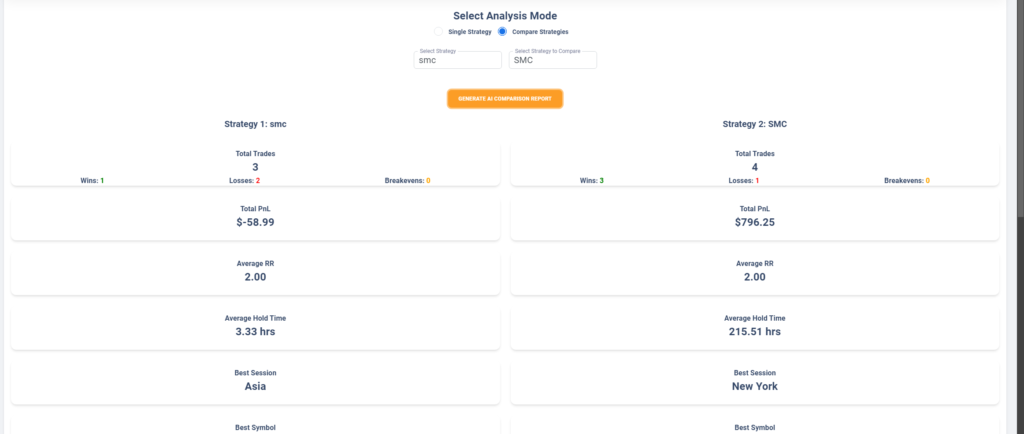
FX Bullsheet takes this further by allowing users to compare multiple strategies side-by-side, analyzing which setups provide better results based on specific metrics and timeframes. The platform’s AI-driven analysis then helps traders make sense of performance trends, drawing insights that might otherwise go unnoticed.
Setting Up a Backtest
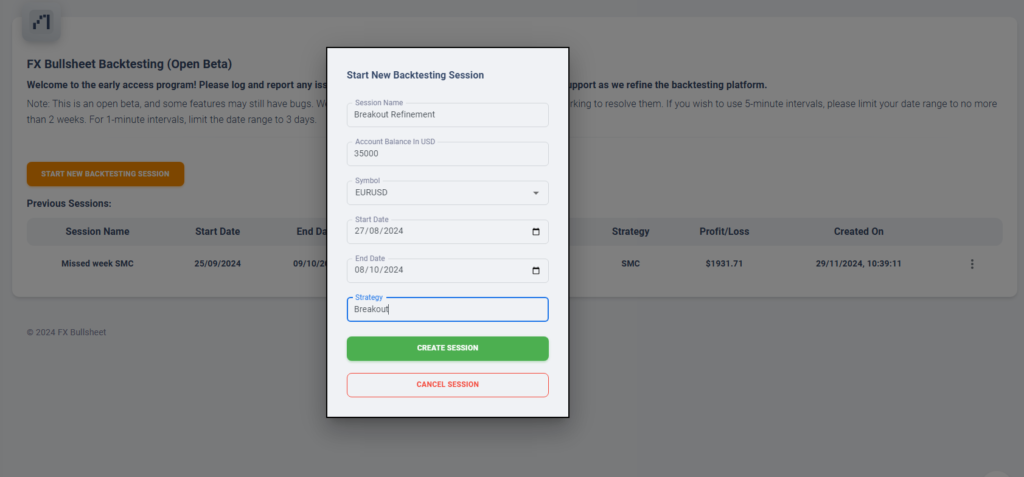
Starting a backtest on FX Bullsheet is straightforward:
- Select Your Market and Asset: Whether you’re backtesting forex pairs (like EUR/USD) or commodities (like gold or oil), FX Bullsheet provides historical data for a range of assets.
- Choose a Date Range and Strategy: Set a custom strategy and date range to trade within, we have over 5 years of historical data.
- Choose a Timeframe: Test strategies on different timeframes (daily, weekly, monthly) to understand how they perform in various trading styles—day trading, swing trading, or position trading.
- Set Parameters: Define entry and exit conditions, stop-loss levels, and position sizes. FX Bullsheet’s playback controls make it easy to adjust these on the fly, seeing how different variables impact outcomes.
- Track Profits and Losses: We allow various methods of placing a backtesting order, from automatic order placing and manual orders to drawing tool orders, leveraging the trading view drawing tools. All shown as realized PnL for closed trades or unrealized PnL for open trades.

Key Metrics to Track
When analyzing backtest results, certain metrics reveal essential details about a strategy’s performance:
- Win/Loss Ratio: This measures the percentage of trades that were profitable versus those that were not.
- Drawdown: Maximum loss from a peak, which shows how much the strategy dips before a recovery.
- Best Session & Symbols: Indicates the overall profitability of each trading session (London, New York & Asia) and the best symbol for your strategy.
- Profit Factor: Measures risk-adjusted returns, which is helpful for understanding a strategy’s risk-reward balance.
FX Bullsheet displays these metrics side-by-side, offering AI-driven insights to help traders spot performance patterns or inconsistencies in their strategies.
Exploring Common Forex and Commodities Strategies
- Moving Average Crossover
This strategy uses two moving averages (e.g., 50-day and 200-day). A buy signal is generated when the shorter average crosses above the longer one, while a sell signal is triggered when the shorter average crosses below the longer one. FX Bullsheet lets you backtest this by comparing different time periods and asset classes, then measuring success with AI-driven analysis to identify trends across trades.
- Relative Strength Index (RSI) Strategy
The RSI identifies overbought or oversold conditions. If RSI drops below 30, a buy signal might be generated; above 70, a sell signal might appear. FX Bullsheet’s backtesting can simulate trades using RSI thresholds, showing how often signals align with profitable outcomes, which can be compared across different markets.
- Breakout Strategy
This strategy involves buying after a price breaks through a previous resistance level or selling when it breaks through a support level. FX Bullsheet enables traders to test breakouts on various timeframes, and with AI, traders can compare different breakout thresholds for insights on success rates and optimal entry/exit points.
4. Smart Money Concepts (SMC)
Smart Money Concepts (SMC) is a popular trading strategy that focuses on tracking institutional traders’ moves. One common SMC strategy is based on Order Blocks and Break of Structure (BOS).
Order Block Strategy:
Traders identify significant price zones where large institutions have previously entered the market. These zones act as support or resistance levels in future price movements.
Break of Structure (BOS):
This strategy looks for shifts in market structure where the price breaks a previous high or low, signaling a trend change. Traders can then enter on retracements to the order block, anticipating that the institutional traders will guide price in a certain direction.
Backtesting SMC with FX Bullsheet:
In FX Bullsheet, you can backtest this strategy by indentifying order blocks manually or using automated charting tools. You can observe how price reacts to your identified order blocks and BOS, refining your entry and exit points. Using the FX Bullsheet AI-driven anaylsis you can compare this strategy to more traditional methods.

Avoiding Common Backtesting Pitfalls
Cheating by Looking a Future Data: A common mistake is looking ahead to see where the market will go, which gives a massive unrealistic advantage. FX Bullsheet helps avoid this by only allowing backtesting from a set start date. this ensures that traders only have access to past data, keeping test fair and based on realistic decision-making without knowing what happens afterwards.
Ignoring Economic Events and Market Conditions: It’s essential to account for varying conditions like high or low volatility, liquidity changes, and macroeconomic events. Traders shouldn’t ignore these events and instead observe how factors impact their strategies. By testing during periods of high volatility or during key economic announcements, traders can better assess whether their strategy holds up under different market conditions.
Comparing and Refining Strategies with FX Bullsheet
One standout feature of FX Bullsheet is its strategy comparison tool, powered by AI. Here’s how it can help:
- Side-by-Side Comparisons: Traders can run multiple strategies on the same asset or timeframe, comparing win/loss ratios, drawdowns, and ROI across them.
- AI-Driven Analysis: FX Bullsheet’s AI assists in identifying which strategies consistently outperform others under similar conditions. It flags potential issues, like higher drawdowns during specific periods, and even suggests adjustments.
- Continuous Improvement: As traders gather insights from backtesting, they can refine their strategies to increase profitability and reduce risk, iterating until they have a well-rounded, reliable approach.

Testing and Applying Strategies
After selecting a winning strategy, the next step is often to test it in a demo environment before live trading. FX Bullsheet’s detailed backtest analysis provides a clear foundation, allowing traders to transition confidently from testing to real trading.
Once you start trading live, you’ll want to track and journal all your trades – which is where our AI-driven trading journal comes into play.
Sign up to FX Bullsheet and access all of these features for less than $16 per month! The most affordable platform for traders of all skill levels.


No responses yet